
Brewing Efficiency Chart
For visual thinkers, this diagram is very helpful in understanding the many types of brewing efficiency:
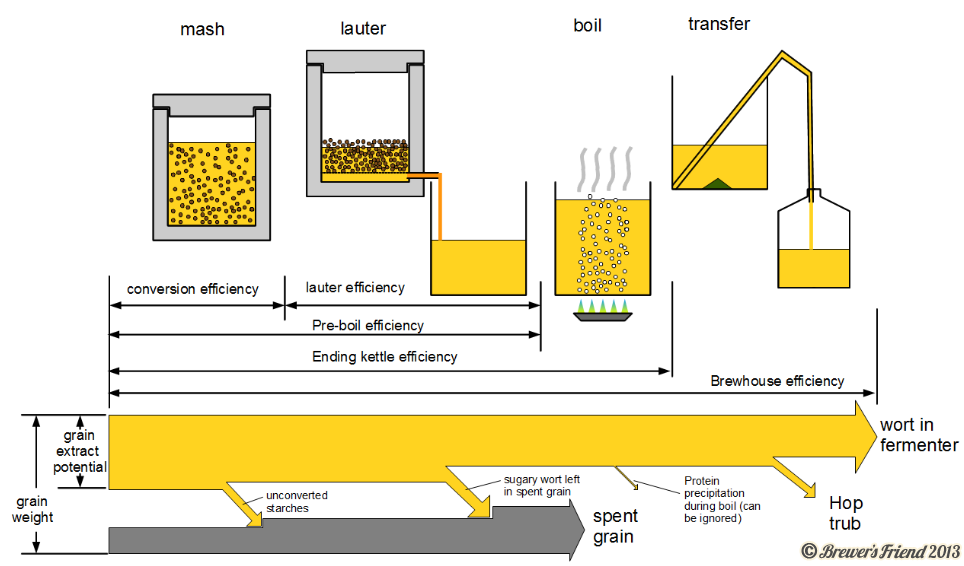
This diagram illustrates where extract (i.e. efficiency) is lost starting with the grain and ending with the dissolved extract in the fermenter.
Conversion efficiency is based main on mash temperature, crush, mash thickness, and pH.
After that, efficiency can only go down, and water/trub losses impact it negatively:
- Grain absorption
- Mash tun dead space
- Hops absorption
- Kettle dead space
- Trub losses
Efficiency is not constant for a given brew rig. Efficiency is constant for a given brew rig and a given recipe. For higher gravity beers, more grain is used, hence there is more grain absorption and lower efficiency. The same is true for hoppy beers – more hops leads to more hops absorption, and lower efficiency. Brewing practices can mitigate this to some extent.
For more reading:
For details on how Brewer’s Friend calculates efficiency, see the following FAQs: