No graphing of ambient temperature?

steinmb

New Member
Premium Member
Joined
May 8, 2014
Messages
28
Reaction score
11
Points
3
Hi
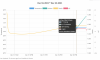
We post session data through the API (streams), fermentation and ambient temperature. I have found no way of getting a graph of the ambient temperature. Is there a way, if so how? I find it especially useful in the yeast exotermic phase, where there could be 5ºC difference between beer and ambient, even on small batches.


Screenshot 2021-01-18 at 21.29.35.png
 
Are you using a Tilt, or something else?
I can’t think of a way to add the temperature, unless your device measures the ambient temperature as well as the beer temp/SG/etc.
 
Not title, but as I wrote, the data is posted through stream (https://docs.brewersfriend.com/api/stream) - Stream allow for you to post the ambient temp. with the probe fermentation temp. And if you look really carefully at the screenshot you might spot the ambient temp. right bellow the fermentation temp.
 
Any more news on this? I had a similar issue last year. I used a microcontroller to measure my chiller temperature and send the temperature data to the session’s data stream. I could never get it to display.
 
Let's see what we can do about this. @Pricelessbrewing what do you think? Can you give some input?
As long as the device sends it, I think this should be doable. I would want it to be toggle-able at the users preference to display on the chart or not. Probably as a dashed line?
 
Toggle-able sounds fine. Dashed line - great. As long as I can see the data I sent alongside the “standard” data. It would be great if I could display more than one data stream at a time. Watching the chiller temperature lets me know when to add more ice during the summer. Watching ambient temperature tells me when to worry about it.
 
Toggle-able sounds fine. Dashed line - great. As long as I can see the data I sent alongside the “standard” data. It would be great if I could display more than one data stream at a time. Watching the chiller temperature lets me know when to add more ice during the summer. Watching ambient temperature tells me when to worry about it.

According to our developer, there is an ambient field you can use for a secondary temp, https://docs.brewersfriend.com/api/stream
 
Yes, I can post to it but I can’t plot the values. I’ll play with this again next week. Life is getting in the way right now.
 
As long as the device sends it, I think this should be doable. I would want it to be toggle-able at the users preference to display on the chart or not. Probably as a dashed line?

@Pricelessbrewing have this feature request gotten a issue number thingy allowing us to follow the progress? If this feature is on your map? +1 at the comment in #7.
 
@Pricelessbrewing have this feature request gotten a issue number thingy allowing us to follow the progress? If this feature is on your map? +1 at the comment in #7.
At the moment we don't have any publicly facing feature request tracker, it's been discussed internally and is something we've agreed would be beneficial but just isn't on the road map at this time. I think it's worth giving a ping on though, so I'll link this thread to that ticket for future follow-up if needed!
 
Thanks for the patience and followup.

There's an update available on beta.brewersfriend.com that adds the ambient temp as an additional charted data point.
 

Attachments

  • 145653556-b420d488-0b84-4729-9a0a-6569feed7007.png
    145653556-b420d488-0b84-4729-9a0a-6569feed7007.png
    493.9 KB · Views: 53
Once it's been tested and reviewed it'll be released to the main site, but if you want to take a sneak peak and make sure the pending update works and satisfies your requests, it is always appreciated!
 
I’d love to. As it happens I’m posting ambient temperature for a brew now. How can I get a look at the beta?
Just head over to beta.brewersfriend.com and login as normal!

Thanks!
 
Looks good, although the similarity between the color of the “Days” gauge (green) and the Ambient graph (slightly different green) is initially confusing. Will the temperature and ambient graphs rescale if a value goes out of range (e.g., Right now the range is 60F to 80F. What happens if ambient = 54F)?
 
Last edited:
Looks good, although the similarity between the color of the “Days” gauge (green) and the Ambient graph (slightly different green) is initially confusing. Will the temperature and ambient graphs rescale if a value goes out of range (e.g., ambient = 54F)?
Generally yes that's the case with the fermentation chart, but good question, I'll need to confirm when I get back from vacation.
 
I edited a value & it looks like the graph rescales as expected. But I did find a problem while editing. I can edit the Ambient entry.

E7140E1F-33C9-416B-AE0A-E2176F73F2AB.jpeg


1B7A67B3-984E-4A5C-840C-C7D206606F2A.jpeg


But if I delete all of the Ambient entry (prior to typing in a new value), the Ambient field disappears.

CB0E43F2-1408-4B1A-BD49-9A3FAC604733.jpeg
 

Back
Top