Graph not showing

Cajunbubba

New Member
Premium Plus Member
Joined
May 25, 2018
Messages
8
Reaction score
1
Points
3
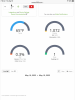
I have two batches fermenting all tilt data being captured by Brewers Friend. Oneof the batches is not showing the graph. It is showing all the data when I click edit data. It is showing the 4 real time “speedometers”. Just not showing the graph. The other batch on a different color tilt is working fine. Thoughts?
 

Attachments

  • 3F32BB6D-940E-40FF-9664-40482238544B.png
    3F32BB6D-940E-40FF-9664-40482238544B.png
    292.8 KB · Views: 53
Thanks. The graph was there for the first hour or two, but then disappeared. If that helps. Data still being logged.
 
I had a bunch of "NaN" readings for gravities the first day. I could not save the edits of them, so I just deleted the dozen or so points and the graph appeared. interesting. I wonder if when I was calibrating to a known point I did something wrong. anyway problem solved.
 
I had a bunch of "NaN" readings for gravities the first day. I could not save the edits of them, so I just deleted the dozen or so points and the graph appeared. interesting. I wonder if when I was calibrating to a known point I did something wrong. anyway problem solved.

NaN is abbreviated for Not a Number. It usually results from zero divided by zero math. A finite number divided by zero usually displays as Infinity. Sadly, given ANSI C standards, this is compiler specific. So, it could be either, but as you can see it's a "divide by zero" error.

I'm sure the programmer can put a fix in. There are intrinsic functions to test for such a things ( isfinite() is the best way, but he'll figure it out ).
 

Back
Top